気になる発熱の問題
CPU 温度が気になります。ラズパイの CPU 温度を測るコードと、それをグラフにするコードを紹介します。Python3 を使います。
負荷かけてないけど
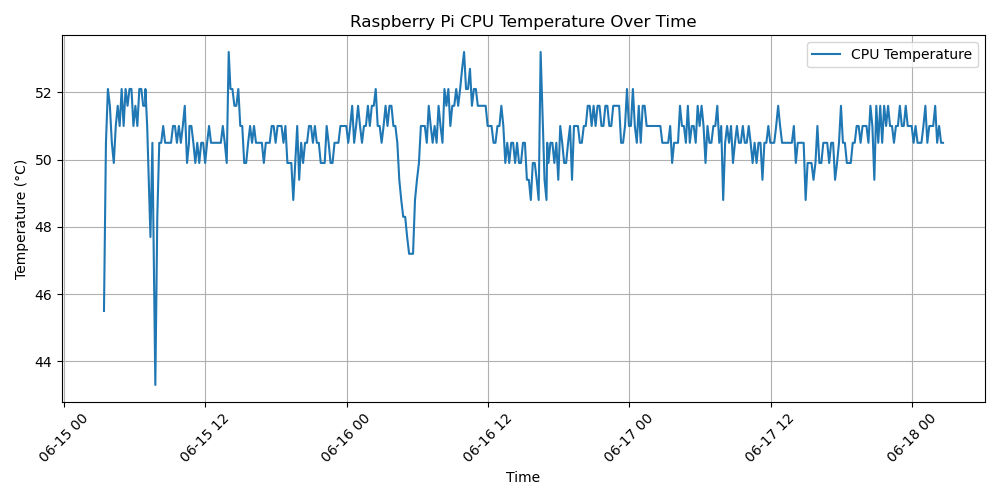
現在、こちらのラズパイ(Raspberry pi 5)の CPU 温度の平均は、51度ぐらい。とくに負荷もかけていないのだけれど、この温度。サードパーティのファンと、プラスチックのケースが悪いのか。それとも、このぐらいが普通なのだろうか。室内温度は、25度ぐらい。
ともかくコード紹介
ともかく、コードを紹介します。PASS, ディレクトリは各自の設定で。いったん、/yourpass/ としておきます。
import time
import csv
from datetime import datetime
import subprocess

def get_cpu_temp():
    # vcgencmdを使って温度を測定
    result = subprocess.run(['vcgencmd', 'measure_temp'], stdout=subprocess.PIPE)
    temp_str = result.stdout.decode()
    temp = float(temp_str.split('=')[1].split('\'')[0])
    return temp

def log_cpu_temp(filename):
    with open(filename, mode='a') as file:
        writer = csv.writer(file)
        if file.tell() == 0:
            writer.writerow(['Timestamp', 'Temperature'])  # ファイルが空の場合はヘッダーを書き込む
        while True:
            temp = get_cpu_temp()
            timestamp = datetime.now().strftime('%Y-%m-%d %H:%M:%S')
            writer.writerow([timestamp, temp])
            file.flush()  # データをファイルに確実に書き込む
            print(f'{timestamp}: {temp}°C')
            time.sleep(600)  # 10分待機

if __name__ == "__main__":
    log_cpu_temp('/home/yourpass/cpu_temp_log.csv')
エラーが発生したら
なにか、vcgencmd コマンドでエラーが出たら sh で sudo コマンド。
sudo mknod /dev/vcio c 100 0
sudo chmod 666 /dev/vcio
グラフで可視化する
10分ごとに、CSV ファイルが書き出されます。それをしばらくためていって(たとえば、一時間とか)。次のコードは、その CSV ファイルをグラフにしてくれるコードです。
import csv
import matplotlib.pyplot as plt
from datetime import datetime

def read_cpu_temp_log(filename):
    timestamps = []
    temperatures = []
    with open(filename, mode='r') as file:
        reader = csv.reader(file)
        next(reader)  # Skip the header row
        for row in reader:
            timestamps.append(datetime.strptime(row[0], '%Y-%m-%d %H:%M:%S'))
            temperatures.append(float(row[1]))
    return timestamps, temperatures

def plot_cpu_temp(timestamps, temperatures, output_filename):
    plt.figure(figsize=(10, 5))
    plt.plot(timestamps, temperatures, label='CPU Temperature')
    plt.xlabel('Time')
    plt.ylabel('Temperature (°C)')
    plt.title('Raspberry Pi CPU Temperature Over Time')
    plt.legend()
    plt.grid(True)
    plt.xticks(rotation=45)
    plt.tight_layout()
    plt.savefig(output_filename)
    plt.close()

if __name__ == "__main__":
    filename = '/home/yourpass/cpu_temp_log.csv'
    output_filename = '/home/yourpass/cpu_temp_plot.png'
    timestamps, temperatures = read_cpu_temp_log(filename)
    plot_cpu_temp(timestamps, temperatures, output_filename)
    print(f"Plot saved as {output_filename}")
こういうグラフが出力されます↓